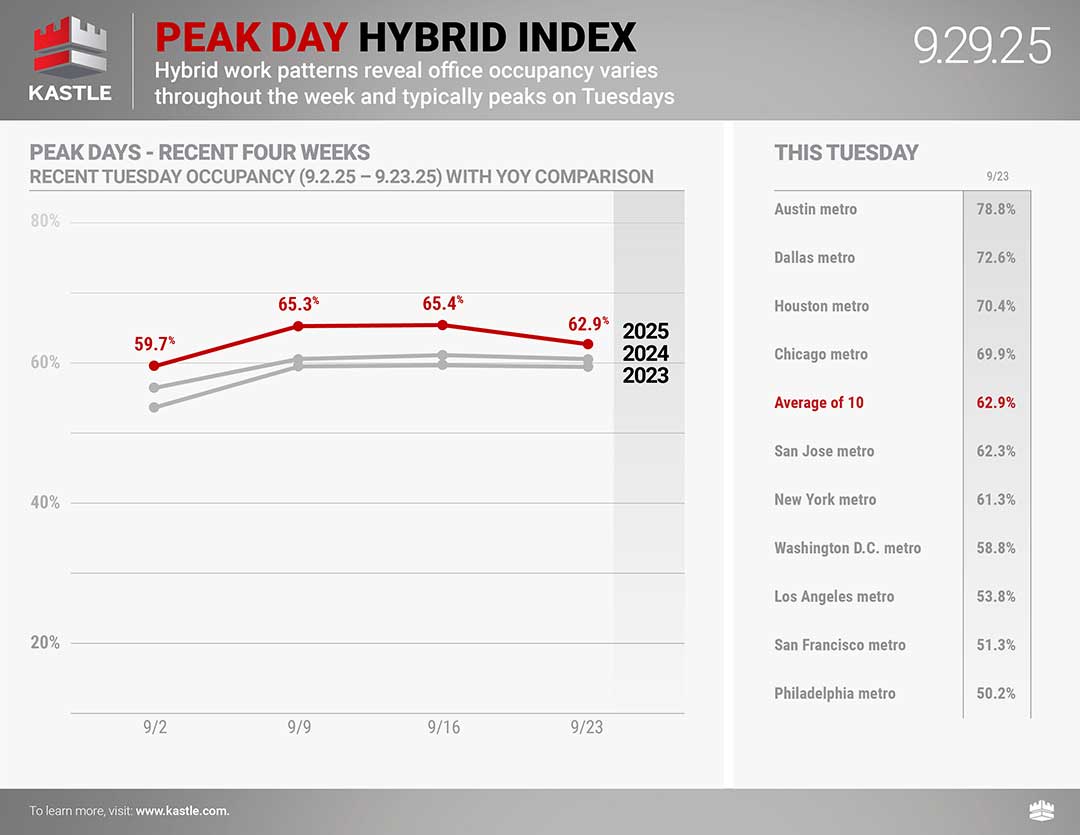
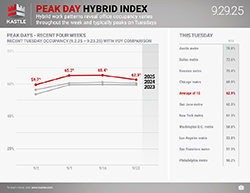
Hybrid work patterns reveal occupancy varies throughout the week with Tuesdays typically being the highest day of the week and Fridays being the lowest. The chart below tracks Tuesday occupancy over time in ten cities and provides a new dimension to the weekly Barometer report. The Peak Day Hybrid Index will now be published weekly, offering a wider aperture into the full picture of workplace occupancy.
Get Weekly UpdatesYou can now track the Return to Work Barometer on the Bloomberg Terminal, available under {ALLX KASL<GO>}
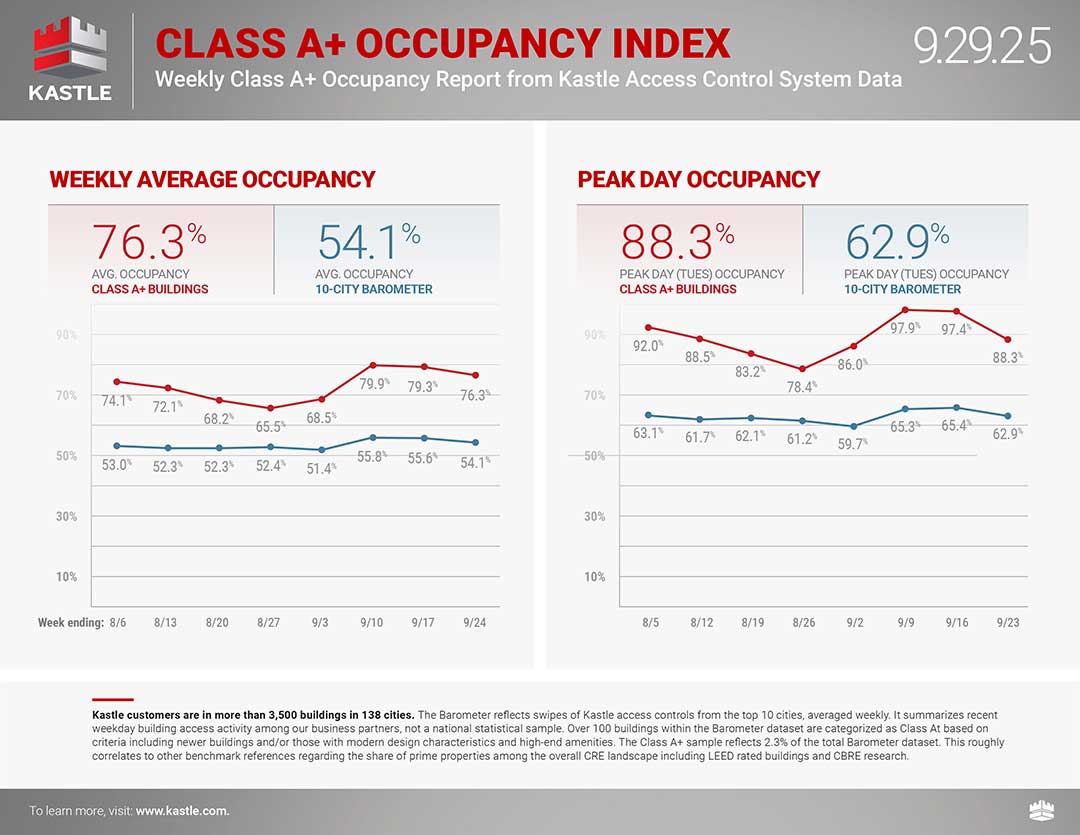
Workers in Class A+ buildings came to the office somewhat less often this past week, with peak occupancy occurring Tuesday, at 96.7%, down more than a point from the prior Tuesday.
Occupancy drifted downward this past week as well, with the 10 City Back to Work Barometer’s peak day (Tuesday) at 64.2%, 1.2 points below the prior Tuesday. Seven Barometer cities experienced a drop in peak single-day occupancy, led by Washington DC, which at 59.5% was down 5.1% from its prior Tuesday.
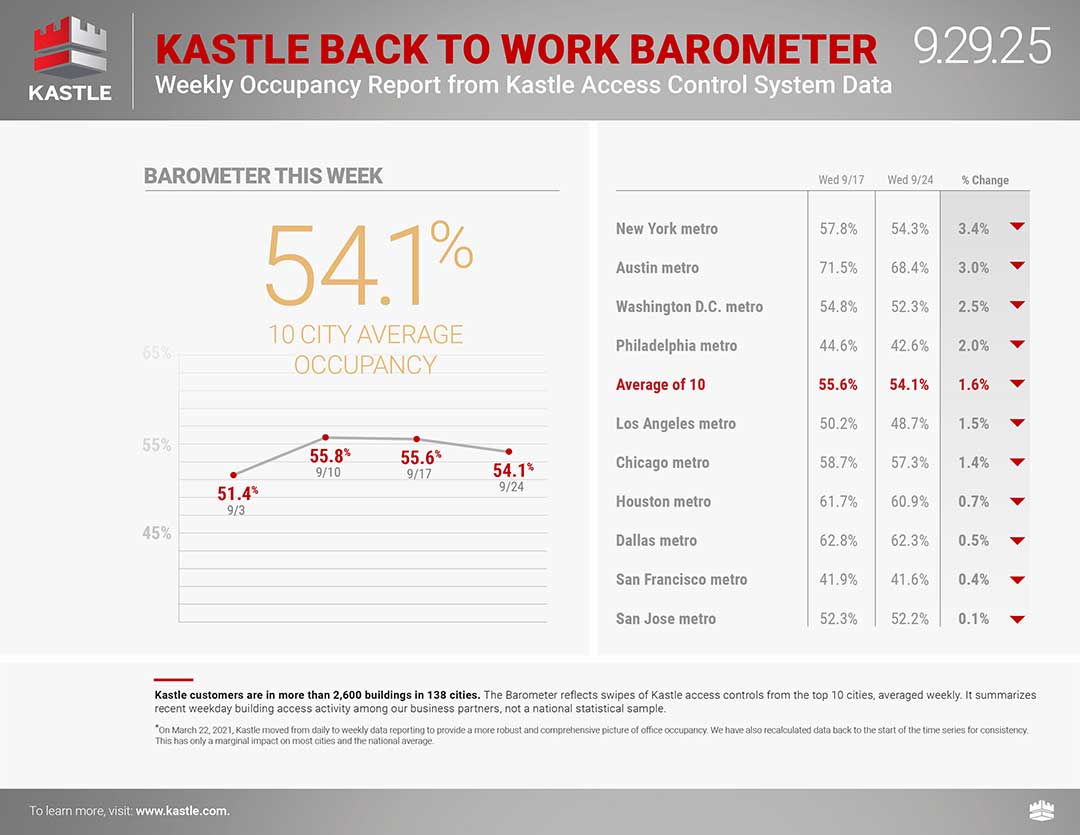
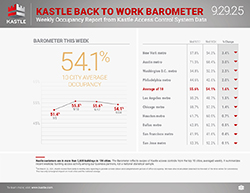
Weekly office occupancy drifted downward this past week, as the 10 City Back to Work Barometer fell 1.3 points, to 54.0%. Among the 10 cities, 7 experienced drops in occupancy. The three exceptions were Houston (up 8 tenths to 62.7%), San Jose CA (up three tenths to 51.7%), and San Francisco (up four tenths, to 42.2%).
NOTE: Due to the stability of the Back-to-Work Barometer data and its very minimal deviation each week, we are now going to be distributing the graphic illustrations of the Barometer only once per month rather than our current weekly cadence. However, we will continue to send the text portion Barometer status email weekly (and add the illustrations every fourth week). We will also only be updating the website Barometer graphic illustrations every four weeks.
Methodology
To provide some clarity on the issues facing American businesses, Kastle has been studying keycard, fob and KastlePresence app access data from the 2,600 buildings and 41,000 businesses we secure across 47 states. We’re analyzing the anonymized data to identify trends in how Americans are returning to the office.
We have tracked and published U.S. office occupancy status in Kastle-secured commercial properties since the beginning of the Covid crisis in early 2020. We continue to seek to help companies navigate the ever-changing workplace landscape and adjust to the ‘new normal’ of office occupancy. Whether full-time hybrid or in-person, our commitment remains to helping American businesses understand how average workplaces are being attended weekly, monthly, and annually.
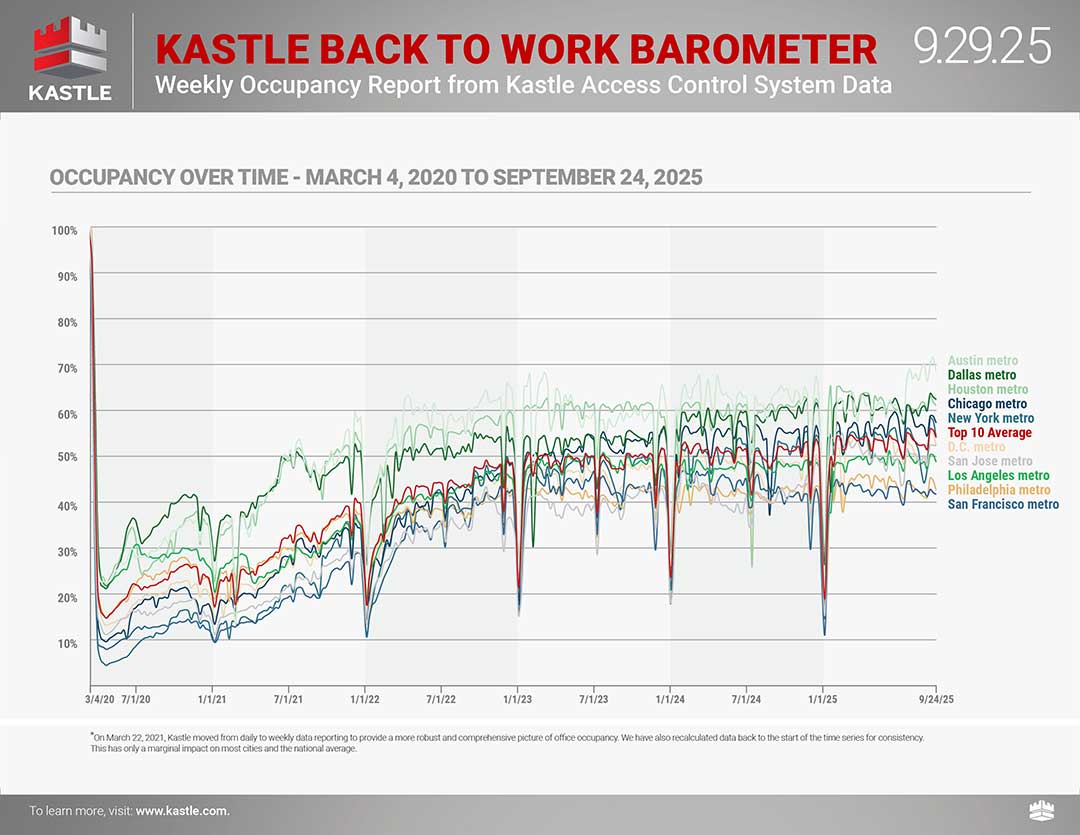
Kastle’s reach of buildings, businesses and cardholders secured generates millions of access events daily as users enter office complexes, and individual company workspaces. The Barometer weekly report summarizes access control data among our business partners in ten major metro areas, not a national statistical sample. Charted percentages reflect unique authorized user entries in each market relative to a pre-COVID baseline, averaged weekly.*
*On March 22, 2021, Kastle moved from daily to weekly data reporting to provide a more robust and comprehensive picture of office occupancy. We have also recalculated data back to the start of the time series for consistency. This has only a marginal impact on most cities and the national average.
Click here for more information about the Barometer methodology and FAQ
Ready to make your property smarter and more secure? Connect with Kastle's experts to find the perfect solution tailored to your needs.

![]()
 Workplace Occupancy Barometer
 Legal Occupancy Barometer
 Barometer Data Science